


Quality and Lean Hub
BASIC STATISTICS DATA EVALUATION — TRAINING DECK + CASE STUDY
BASIC STATISTICS DATA EVALUATION — TRAINING DECK + CASE STUDY
Couldn't load pickup availability
Most operational decisions are still made on opinion and habit. This complete quality fundamentals course teaches your team to read the data a process actually produces — summarize it, question it, and turn it into a decision they can defend. No statistics background needed: it's built from scratch, in plain language, and every module ends by applying the method to a real plant-capacity problem.
Perfect for continuous-improvement and Lean practitioners, quality and operations people, team leaders, trainers, and any manager who has to justify a call with evidence rather than a hunch.
WHAT YOU GET
- Training slides (PPTX): a guided 5-module deck that builds it up from scratch — types of data, graphical analysis, descriptive statistics, and sampling, inference & decision making, with a hands-on checkpoint after every module.
- A real case study (DOCX + PDF): "Meridian Assembly" — a full plant-capacity investigation you solve with the exact method taught in the course, complete with facilitator answers and model conclusions.
- The data set (XLSX): 40 weeks of daily throughput on two parallel assembly lines — the same data used in the case study, ready to graph and analyze in Excel or any statistics tool.
FIVE MODULES, ONE CLEAR PATH
1 - Types of Data: numerical vs categorical, discrete vs continuous, nominal vs ordinal — and how the question you ask decides the distribution you expect (binomial, Poisson, normal).
2 - Graphical Analysis: the four essential charts — histogram, Pareto, box / individual-value plot and run chart — and how to read a trend from a shift.
3 - Descriptive Statistics: location (mean, median, mode), spread (range, variance, standard deviation, coefficient of variation) and shape (skewness and kurtosis).
4 - Sampling, Inference & Decision Making: sample vs population, confidence intervals, how much to sample and how, and turning an inference into a "act now or wait" decision.
5 - Wrap-up: consolidate the method and connect it back to daily work.
A METHOD THAT STICKS: READ → DESCRIBE → DECIDE
- Read: recognize the data type and choose the right analysis for it.
- Describe: summarize performance with the right graph and a few key statistics.
- Decide: use the summary — and its uncertainty — to act, or to wait, on purpose.
THE RUNNING CASE STUDY — MERIDIAN ASSEMBLY
You manage a newly acquired final-assembly plant facing 10% demand growth — beyond anything it has handled before — and capacity is the biggest risk to the plan. Using 40 weeks of daily throughput from two parallel lines, you classify the data, chart it, summarize it and draw an inference. The run chart reveals a clear upward shift on line A right when a 5S Lean pilot began — about a 7% lift in daily output — pointing straight to a testable way to move capacity toward the forecast. Learners reach the conclusion themselves; the facilitator answers are included for you.
WHY TEAMS LOVE IT
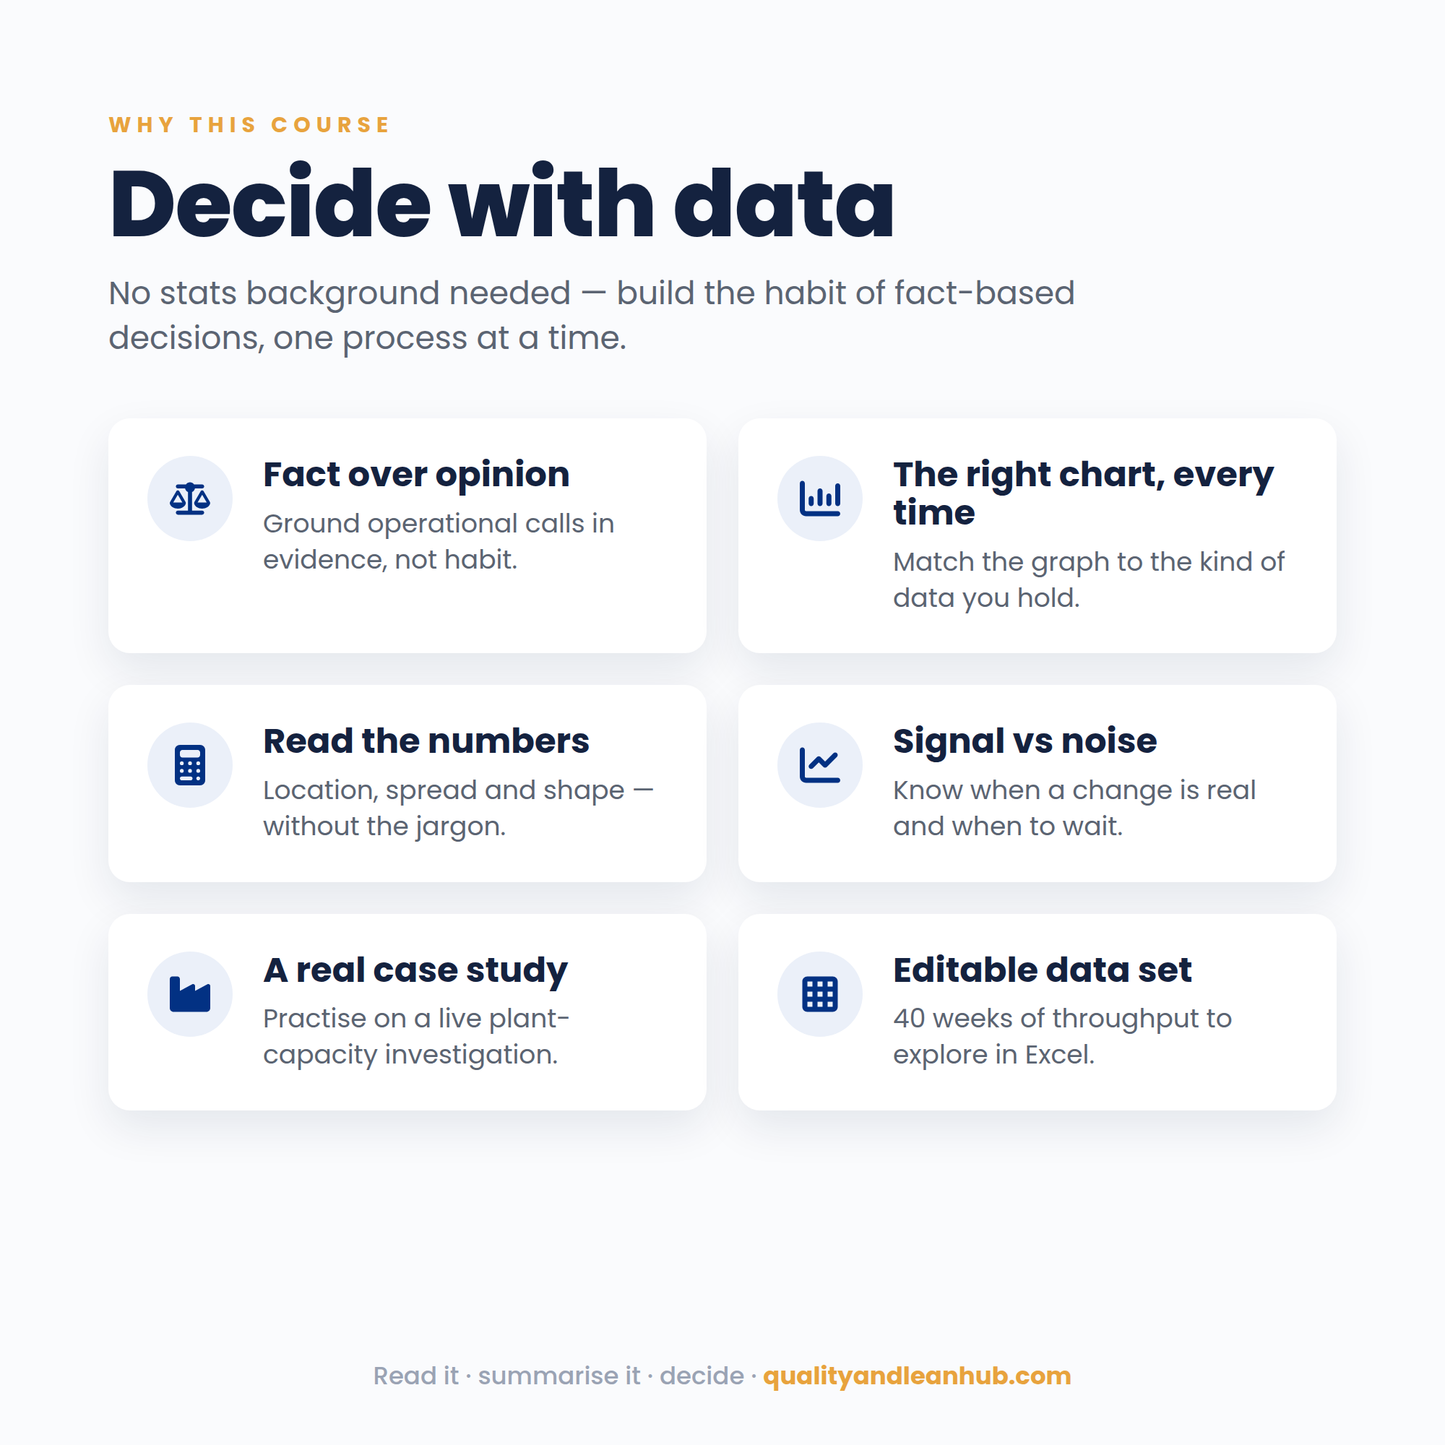
- Fact over opinion: ground operational decisions in evidence, not habit.
- The right chart, every time: match the graph to the kind of data you hold.
- Read the numbers: location, spread and shape without the jargon.
- Signal vs noise: know when a change is real and when to wait.
- A real problem, not a toy example: practice on a live plant-capacity case.
- No background needed: built from scratch; anyone on the team can follow.
- Fully editable: adapt the deck, the case study and the data set to your world.
- Instant download: get everything the moment you buy.
WHAT'S IN THE DOWNLOAD
- 1 x Training deck — .pptx (5 modules, fully editable)
- 1 x Meridian Assembly case study — .docx (with facilitator answers)
- 1 x Throughput data set — .xlsx (40 weeks, two lines)
Instant digital download. For personal and in-company training use.
Share


Disclosures
Disclosure - Digital Products
Disclosure - Digital Products
Please read before purchasing. This is a digital product delivered electronically, nothing is shipped. After purchase you will receive instant access via email for unlimited download.
Formats & requirements: Delivered as PDF, PPTX, DOCX and editable Excel files; requires Microsoft Office Package and PDF reader.
License: For personal and internal business use only. You may not resell, redistribute, share, or sublicense these files.
Please note: This product is provided for general educational and informational purposes. It does not constitute legal, regulatory, or professional advice, and we do not guarantee specific results, savings, audit outcomes, or certification. Standards evolve, always verify against current requirements. Any references to standards or marks (e.g. ISO, Lean, Six Sigma, ASQ) are the property of their respective owners; this product is not affiliated with, endorsed by, or certified by those organizations.
All digital purchases follow the refund policy statement. If a file is faulty, not as described, or won't download, contact us at qualityandleanhub@gmail.com and we'll fix it or refund it as applicable.